
Last month the team went to KubeCon Barcelona. It was an amazing experience, one I hope to repeat 🙌🏼. It got me inspired to do a blogpost regarding the technologies around Kubernetes.
Back in KubeCon Seattle, the big topic of the conference was Service Mesh. This time around, in Barcelona, the theme was Observability inside the Service Mesh.

Microservices has been the preferred design for building services at scale for the last few years. While it makes it easy to build, optimise and maintain services, it also introduces some challenges of its own when the number of services and the complexity of the interaction in between them grows. Such a network is called a Service Mesh.
Service Mesh Platforms — like Istio and LinkerD — aim to solve some of the debugging and management problems of the microservices architecture at scale. It does so by taking advantage of a sidecar to which all the container’s traffic must be proxied through.
The sidecar allows for features like load-balancing, service-to-service authentication, service discovery, monitoring and others.
Istio was built in 2017 as a collaboration between IBM, Lyft and Google. It leverages the Envoy proxy and provides a universal control plane to manage underlying service proxies. Envoy is a high-performance C++ proxy deployed as a sidecar to every relevant service on a Kubernetes pod. It collects metrics on traffic coming in and out, this allows the Mixer to enforce access control and feeds the monitoring systems providing knowledge regarding the entire mesh (as seen in Fig.1).

To showcase some of the platform’s features, let’s deploy a sample BookInfo application. This application is composed of four separated microservices written in different languages, where some services have multiple versions. The architecture is explained in Fig. 2.

Traffic Management with Istio
One major feature of Service Mesh Platforms is traffic management. As the complexity of the interaction between services grows, so does the requirements for more advanced service-to-service communication control.
Request Routing
Sometimes it is useful to be able to control traffic routing based on different characteristics. Maybe we want to serve a certain version of our application based on HTTP request headers, cookies or agents.
On Istio, we do this by using VirtualServices and DestinationRules. VirtualService’s define a set of traffic rules to apply when a host is addressed. If matched, the destination property points to the DestinationRule of that host and the subset property selects the specific version of the service we intend to target.
In the following example will send all the traffic from the user “jason” to reviews:v2, meaning requests from such user will only see black star reviews on our Books App.
Chaos testing and Fault injection
While stress testing your application, it might be helpful introducing failures in specific pieces of the infrastructure. Simulation of network partial or complete downtime may be necessary. Let’s say we wanted all the traffic from this same user “jason” to experience a seven seconds delay on every ratings service call. We could use the following configuration to achieve just that.
A/B Testing and Canary Releases
When rolling out big features, sometimes it’s good to expose them to only a subset of users, monitor its behaviour and gradually increase the size of the group. Traffic shaping for A/B Testing can be achieved by splitting the traffic between two different versions of the application. The rule bellow ensures that 50% of the traffic to the reviews service is routed to version v2 (black stars) and 50% to v3 (red stars).
Masquerading Service or Network failures
Sometimes stuff breaks, services fail, network connections drop. Although Istio does not help prevent these issues, it helps to manage its impacts on the overall application. Simple retries can be enough to masquerade temporary service outages. Let’s introduce service failures in our ratings service.
This failure feature is activated through an environment variable that can be passed on the ratings service deployment YAML.
Now the ratings service is failing half the times. We could masquerade some of the damage by implementing a simple retry policy on every rating service call.
In a real application, probably retrying all failed HTTP requests wouldn’t make sense. Some HTTP status codes, like the 4xx, wouldn’t yield a different output just by retrying. We could further specify that retrials should only be attempted for certain network failures.
Observability with Istio
The purpose of monitoring for cloud-native applications is slightly different. Instead of monitoring in order to avoid failure, monitoring is done to manage failure. Monitoring such a fluid system such as a Service Mesh requires it’s pieces to be observable. Each entity must produce appropriate data to support automated trouble detection and alerting and also enabling manual debugging when needed.
To be Observable, services should produce the following kinds of data:
- Health Checks — usually HTTP health checks. Achieved natively through the KubeAPI.
- Metrics — quantitative information about processes running inside the system. These range from resources utilisation, to amount of http 5xx status codes.
- Log Entries — discrete representations of events that happened over time. These are crucial to debug the application in case of crashes.
- Traces — track the flow of requests through the system. Essential not only to captures the relation between services but also the order of tasks triggered by the request.
Logs
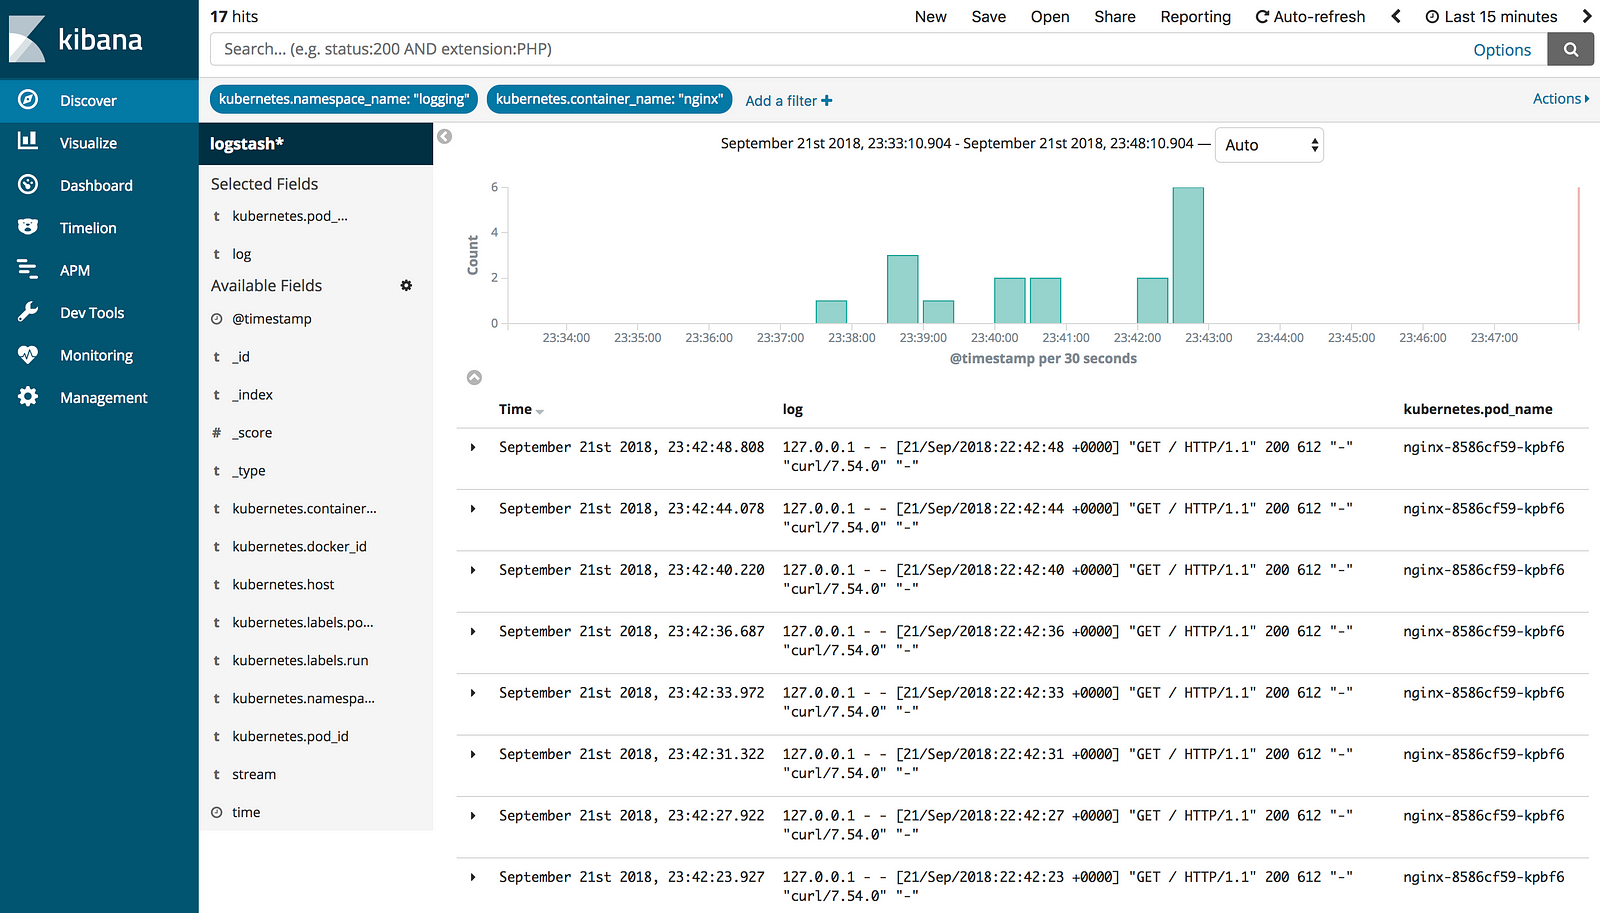
If not aggregated, logs will get lost. Hence we need a tool — like Fluentd — that scrapes logs from all the nodes and stores them in a persistent data store, such as Elasticsearch. Elasticsearch, an open source analytics engine, can be queried directly or interacted from Kibana, a visualisation dashboard. Together the three technologies form the EFK stack.

At the end of the day, the important thing is choosing a tool that will allow you to capture logs and provides you with the ability to accurately navigate them when a diagnosis is needed.
Metrics
For a Service Mesh running on a Kubernetes cluster, metrics should be collected at many levels. From the underlying nodes, to application pods and network performance, metrics should be collected and stored at all these different levels.
Prometheus is an open-source systems monitoring and alerting toolkit. It scrapes metrics from instrumented jobs and stores all scraped samples on a time-series database. Grafana or other API consumers can be used to visualise the collected data. Grafana is an open source data-visualisation tool that can aggregate data from many sources and provide a summary view of crucial key metrics.

Metrics are also the ideal data source for triggering alerts. Alerts are triggered when the system is not corresponding according to service level indicators (SLI) and indicate that a human should take action. Alerts can be for example Slack notifications.
Tracing
Traces causally relate events that are part of the same request flow inside the mesh. They allow us to observe the path a request takes and the services it interacts with. Each request is assigned a unique ID and for each step in the flow it’s the service’s responsibility to add helpful metadata, referred to as span, before passing along the request. Jeager is an open source tool that allows you to visualize and inspect distributed traces. In cases where certain endpoint is displaying slow response times, traces help us figuring out in which service the problem lies, thus guiding the next diagnosis’ direction.

Wrapping Up
Service mesh platforms are no silver bullet. For some companies or project sizes it may not make sense to invest resources in migrating to such platform. And for the ones it does, the team must be aware of the challenges and added complexity it may imply.
Observability tools are amazing sources of information when it comes to debugging and diagnosing particular critical situations. But these tools are only as good as the team using them. The team may have the best logging and tracing setup but if no one is using them, they are worthless. If you are planning to integrate such tools, make sure you bring the rest of the team on-board.


.png)
